With a powerful Mac comes great responsibility to keep it performing the way it should.
Because nothing kills the mood faster than an app freezing mid-task, right? When that happens, it’s important to figure out if it’s the app, the disk, or the Mac slowing down.
I’ll guide you through the exact performance checks I use – real-time monitoring, quick scans, built-in utilities, deeper diagnostics, speed tests, a few third-party helpers that make the whole thing painless, and the fixes that make a slow Mac snap back instantly.
Mac performance check-up: sluggish vs. obsolete
Not all slowness is created equal. First, figure out which kind of ‘slow’ you have:
1. Sluggish Mac – capable hardware, overwhelmed system
This is the scenario where your Mac can perform well, but something in the moment is dragging it down. Common signs include:
- Cursor freezes during indexing
- Fans spike when multitasking
- CPU spiking without reason
- Memory pressure is turning yellow/red
- Swap and disk thrashing
- Indexing in the background slows things down
- Apps trigger heavy disk I/O
- Long boot times caused by too many login items, startup apps
Check with: Activity Monitor (CPU, Memory, Disk), iStat Menus.
2. Genuinely slow Mac – hardware bottleneck
In this case, your Mac isn’t struggling because of the workload; it’s struggling because its hardware can’t deliver more. The slowdown is consistent, doesn’t disappear when you close apps, and baseline performance deficit caused by:
- overheating Intel CPUs under basic load → thermal throttling
- 8GB RAM running out the moment heavy apps open (8 GB in 2025 is limiting)
- slow/aged SSD → SSD benchmarks far below expected speeds
- degraded battery → CPU frequency reduction
- older generation chipset
Tools to confirm: Geekbench, Disk Utility, Disk Speed Test, battery health check.
The first group benefits from optimization. The second requires upgrades or a new Mac.
What affects Mac performance?
To identify which ‘slow’ you’re dealing with, you’re supposed to look under the hood and understand why your Mac behaves the way it does.
Performance isn’t only about raw specs; it’s also about the condition of your system.
Let’s combine everything above with a practical checklist.
1. Mac chip/processor
- Apple Silicon (M1/M2/M3 and newer) chips are cool, efficient, rarely overheat, and maintain peak performance almost all the time.
- Intel Macs, on the other hand, heat up quickly and throttle even under moderate load.
If your Mac throttles:
- Expect lag in Chrome, Figma, video calls, and rendering apps
- CPU frequency gets cut
- UI responsiveness dips
- Fans run often
Check your processor: Apple logo in the top-left corner → About This Mac → Chip.

If it says Intel, the Mac might be past its prime.
2. RAM/Memory
macOS thrives on RAM. In 2025, 8GB is entry-level, and it struggles with Chrome, Figma, Slack, or a handful of tabs. If your workload includes multitasking, creative tools, or development, 16GB is the comfort zone.
Check yours: Apple logo in the top-left corner → About This Mac → More info… → Memory.

If RAM fills up:
- Memory pressure turns yellow/red
- Swap starts
- SSD is hit with constant read/write
- Everything slows down
3. Mac disk space: keep at least 15-20% free
SSD health directly impacts macOS responsiveness. When disk space drops too low:
- Spotlight indexing slows
- Time Machine struggles
- SSD wear increases
- System cache grows unstable
- Apps launch slowly
- macOS can’t create swap efficiently
Check your storage: System Settings → General → About → Storage.
Hover the storage diagram to see Available.

If that value is low, cleanup isn’t optional; it’s performance insurance.
4. Login items & background daemons
Cloud clients, messengers, updaters, menu bar apps, and VPN tools load on boot and consume RAM and CPU 24/7.
5. Background indexing
Spotlight, Mail, Photos, Time Machine, and iCloud syncing often kick off indexing tasks, slowing the system temporarily.
If indexing gets stuck, reindex via:
- Spotlight or respective app settings, or
- MacCleaner Pro (one-click reindex)

6. Mac battery health
If your battery is degraded, macOS goes into ‘power-saving mode’ and reduces CPU speed.
Check battery: Click the battery icon in the top menu bar → Service Recommended.
If this appears, replacing the battery is necessary to restore performance.

Top tools to check Mac performance
macOS comes with a surprisingly strong set of diagnostics tools. Most users never open them, but once you know where to look, they give you a full picture of what’s happening inside and how to fix issues right on the spot.
Unlock each tool below, what it shows, and how to use the results to optimize your Mac.
Activity Monitor (built-in real-time performance dashboard)
Activity Monitor is the closest thing to a ‘mission control’ panel for your Mac. If something is draining battery, eating CPU, hogging memory, or hammering your SSD, you’ll spot it here within seconds.
CPU
What it shows:
- Apps using high CPU (100-300% CPU on multicore Macs)
- Background processes stuck in loops
- Heat spikes (common on Intel)
How to optimize:
- Quit apps stuck at high CPU for more than a minute.
- Disable extensions or plugins inside the misbehaving app.
- If a system process (like mds) is spiking, allow indexing to finish or free disk space.

Memory
What it shows:
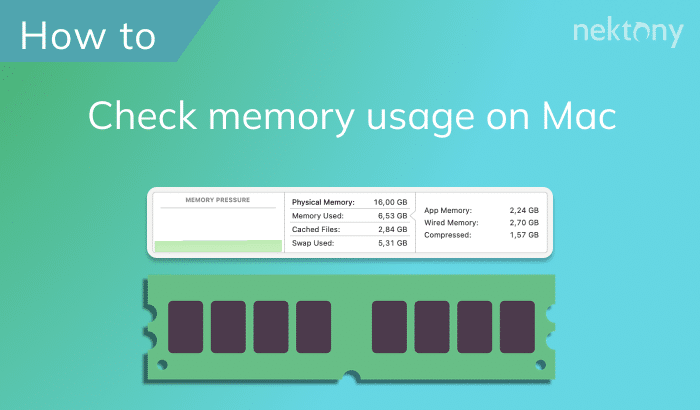
- The Memory Pressure chart (your main RAM health indicator)
- How much swap space macOS is using
- Apps with memory leaks (steadily increasing usage)
Memory pressure colors:
- Green → no issue
- Yellow → RAM getting full
- Red → macOS is swapping heavily and will feel laggy
How to optimize:
- Quit browser tabs or RAM-heavy apps (Chrome, Figma, Slack).
- Restart apps with memory leaks.
- Restart the Mac if memory pressure remains high after closing apps.
- Reduce startup apps so RAM isn’t consumed at boot.

Free and deep alternative: Memory Cleaner
Energy
What it shows:
- Apps draining battery
- Apps preventing sleep
- Heavy background tasks
How to optimize:
- Close or uninstall battery-hungry menu bar apps you don’t use.
- Disable ‘Prevent computer from sleeping’ options in specific apps.

Disk
What it shows:
- Live read/write activity
- Apps thrashing the SSD (common when swap is high)
How to optimize manually:
- Free 15-20% of disk space.
- Pause cloud syncing (iCloud, Dropbox) if they constantly write data.
- Identify and quit apps writing gigabytes per second unexpectedly.

Network
What it shows:
- Apps consuming bandwidth
- Apps stuck syncing or uploading
How to optimize:
- Pause sync clients temporarily.
- Turn off unused VPNs.
- Restart apps that show constant high data use without reason.

If something spikes relentlessly, you’ve found your bottleneck.
Free network optimizer/firewall: FireWally
Benchmarks & speed tests
Diagnostics can tell you what is happening…
Benchmarks tell you how your Mac compares to what it should be delivering.
Geekbench (free benchmark)
Great for checking:
- CPU performance
- GPU performance
- Possible thermal throttling
If your score is significantly lower than Macs of the same model:
- Your CPU is overheating
- Background processes are consuming resources
- The system needs a restart
- Or macOS needs a cleanup

Disk speed test (Blackmagic Disk Speed Test or similar)
Your SSD is one of the biggest performance drivers on modern Macs.
Expected read/write speeds:
- Apple Silicon: 2500-3500 MB/s+
- Intel: typically 500-1500 MB/s, depending on age
Low scores mean:
- SSD is nearly full
- SSD is aging
- Spotlight or Photos are indexing heavily
- External storage interference
How to optimize:
- Clear caches
- Delete large files
- Move media to external drives
- Disable Background App Refresh for apps you don’t need to sync constantly
Temperature monitoring (Macs Fan Control)
This tool shows CPU, GPU, SSD, and battery temperatures and fan speeds in real time.
Thermal throttling starts around:
- 95-100°C on Intel Macs
- Upper 80s for sustained load on Apple Silicon
If temps remain high:
- Quit CPU-heavy apps
- Move the Mac to a cooler surface
- Avoid using on blankets/soft surfaces
- Clean dust from vents (especially Intel models)
- Reduce external monitor usage (GPU gets hotter)
That explains sudden slowdowns better than any other metric.

Disk Utility (disk health & file system integrity)
Disk Utility helps you see whether your disk itself is part of the problem.
When your Mac feels slow, freezes when opening files, or Time Machine and Spotlight act weird, it’s worth checking the disk’s health.
How to run Disk Utility First Aid (standard check):
- Open Disk Utility
- Go to Finder → Applications → Utilities → Disk Utility
- In the sidebar, select your startup volume (usually Macintosh HD).
- Click First Aid in the toolbar.
- Confirm with Run and let the process complete.
- If it reports minor issues and repairs them successfully, you’re good.
Deeper check (container/physical disk):
If you suspect more serious issues (frequent freezes, read/write errors, Time Machine failures):
- In Disk Utility, click View → Show All Devices.
- In the sidebar, select:
- The volume (e.g., Macintosh HD)
- Then the container
- Then the physical disk (topmost entry)
- Run First Aid on each, starting from the top and working down.
What results mean:
- No issues found → disk structure is healthy
- Errors repaired → performance may improve immediately
- Errors can’t be repaired → backup ASAP, SSD may be failing
Apple Diagnostics (hardware health scan)
Apple Diagnostics looks at the hardware as a whole: memory, logic board, sensors, wireless modules, and sometimes storage. It’s especially useful when:
- Your Mac is slow and randomly restarts.
- You suspect RAM or logic board issues.
- You want to rule out hardware before reinstalling macOS.
What it detects:
- Failing RAM
- Logic board issues
- Sensor failures
- Power management issues
- Wireless module problems
- Some SSD problems
How to run Apple Diagnostics (Apple Silicon Macs):
- Shut down your Mac.
- Press and hold the power button until you see Loading startup options.
- When the options screen appears, press and hold Command (⌘) + D.
- Apple Diagnostics will start and scan your Mac.
- When it finishes, you’ll see either “No issues found” or specific reference codes.
How to run Apple Diagnostics (Intel Macs):
- Shut down your Mac.
- Turn it on and immediately press and hold D.
- If that doesn’t work, try Option (⌥) + D to run diagnostics over the internet.
- Wait for the test to complete and note any error codes.
How to optimize before resorting to diagnostics:
- Reset NVRAM/PRAM (Intel Macs)
- Reset SMC (Intel Macs)
- Update macOS
- Restart the system to clear memory leaks
Basics on how to optimize Mac performance
1. Keep disk space healthy
macOS likes 40-50GB free for indexing, caching, and updates. This also ensures:
- smooth Spotlight operation
- efficient swap space
- stable Time Machine backups
MacCleaner Pro shows disk usage right in the Overview tab and removes junk in a few clicks – in some cases, freeing 30+ GB instantly.

2. Clean up login items regularly
Every auto-launched app eats RAM, CPU, and battery. Disable everything you don’t need launching automatically.
Check your login items: System Settings → General → Login Items & Extensions.

Or manage them cleanly via MacCleaner Pro → Speed Up → Startup apps.

3. Optimize RAM proactively
If you frequently run into yellow/red memory pressure, optimize RAM or reduce heavy apps. You can improve memory performance using:
- Activity Monitor → Memory
- MacCleaner Pro → Speed Up → Optimize RAM

4. Keep the system clean
Caches, logs, old updates, unused apps, they build up silently. It’s better for your Mac to get rid of them.
MacCleaner Pro’s Clean Up module handles:
- system junk
- caches and logs
- purgeable space

5. Keep CPU temperature under control
High CPU temperatures are a silent performance killer. To protect hardware, macOS reduces CPU frequency when heat spikes, a process known as thermal throttling.
What to do:
- Monitor temps with Macs Fan Control
- Watch for sustained temperatures above 90-95°C
- Reduce background apps and indexing tasks
- Avoid heavy workloads on battery (especially on Intel Macs)
Final test
At this point, you’ve checked the usual suspects and tuned the system. Now it’s time for a quick final exam to see where your Mac really stands.
- Activity Monitor: Mac is calm at idle, no runaway apps
- Disk Utility → First Aid: No unrepaired errors
- Apple Diagnostics: No hardware codes
- Disk speed test: SSD not painfully slow for its class
- Battery health: No Service Recommended warning
If you pass most of these and your Mac feels better after a cleanup, you’re dealing with a sluggish-but-capable machine. Maintain it, keep disk space free, and it’ll serve you longer.
If you fail several of these, especially Intel CPU + 8GB RAM + bad battery or weak SSD scores, you’re looking at hardware limits, not just macOS being slow. That’s your sign to stop fighting the computer and start thinking about an upgrade.


